Chapter 4
Debugging
Breakpoints, stepping, variables, evaluate, exceptions, history, performance and tests.
Breakpoints and debugging
The debugger runs your project (desktop or web) and stops it at the lines you choose in your code: the code generated from the design is not debugged. There is nothing to install: it uses the Python standard library.
- In the Code tab, click to the left of a line number to set a breakpoint (a red dot); another click removes it. F5 sets it on the cursor line.
- Right-click the dot to give it a condition (for example
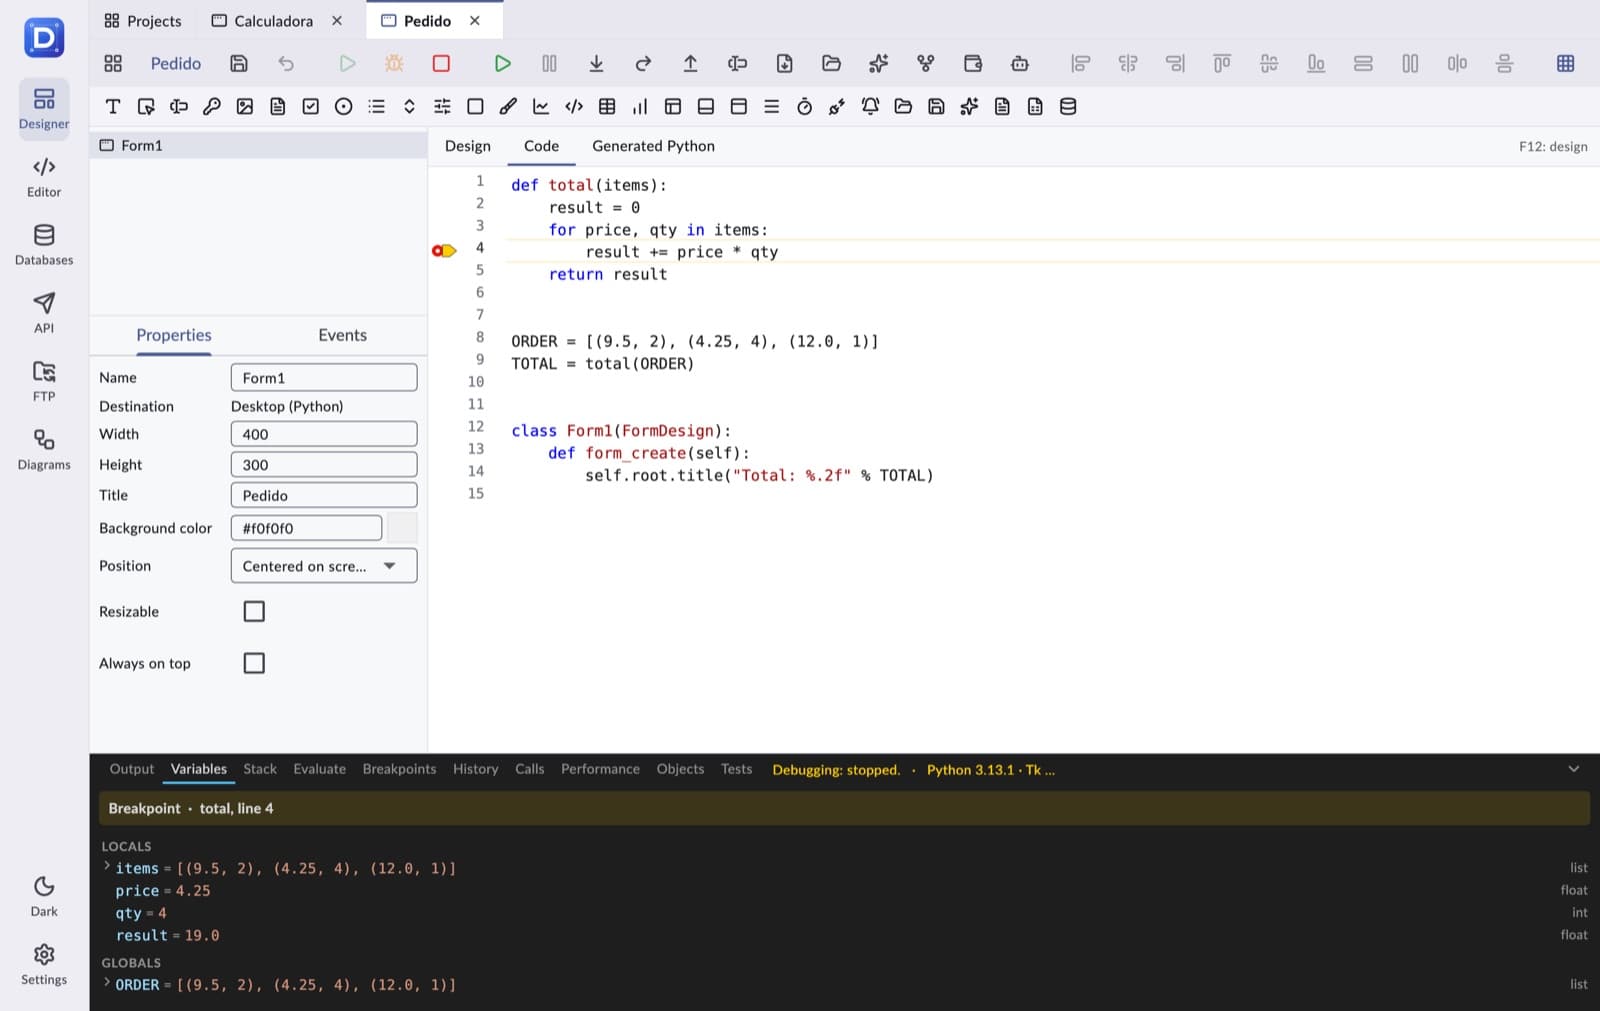
qty == 4): it only stops when it is true. It shows a white dot inside. - Press Debug (the orange bug, Shift+F9). The program starts and stops when it reaches a breakpoint: the yellow arrow marks the line and the bottom panel opens Variables.
Stepping
| Button | Shortcut | What it does |
|---|---|---|
| Continue | F9 | Runs to the next breakpoint |
| Step into | F7 | Runs the line and steps into the functions of your code it calls |
| Step over | F8 | Runs the whole line without stepping into functions |
| Step out | Shift+F8 | Runs until it returns to the caller of this function |
| Run to cursor | F4 | Runs to the line where the cursor is |
| Pause | Stops the program at the next line of your code that runs | |
| Stop | Ctrl+F2 | Ends the program |
While it is stopped, the window (or the web page) does not respond: that is normal. When you continue, it carries on where it was.
Variables, stack and evaluate
- Variables: the locals and globals of the chosen frame. Lists, dictionaries and objects (such as
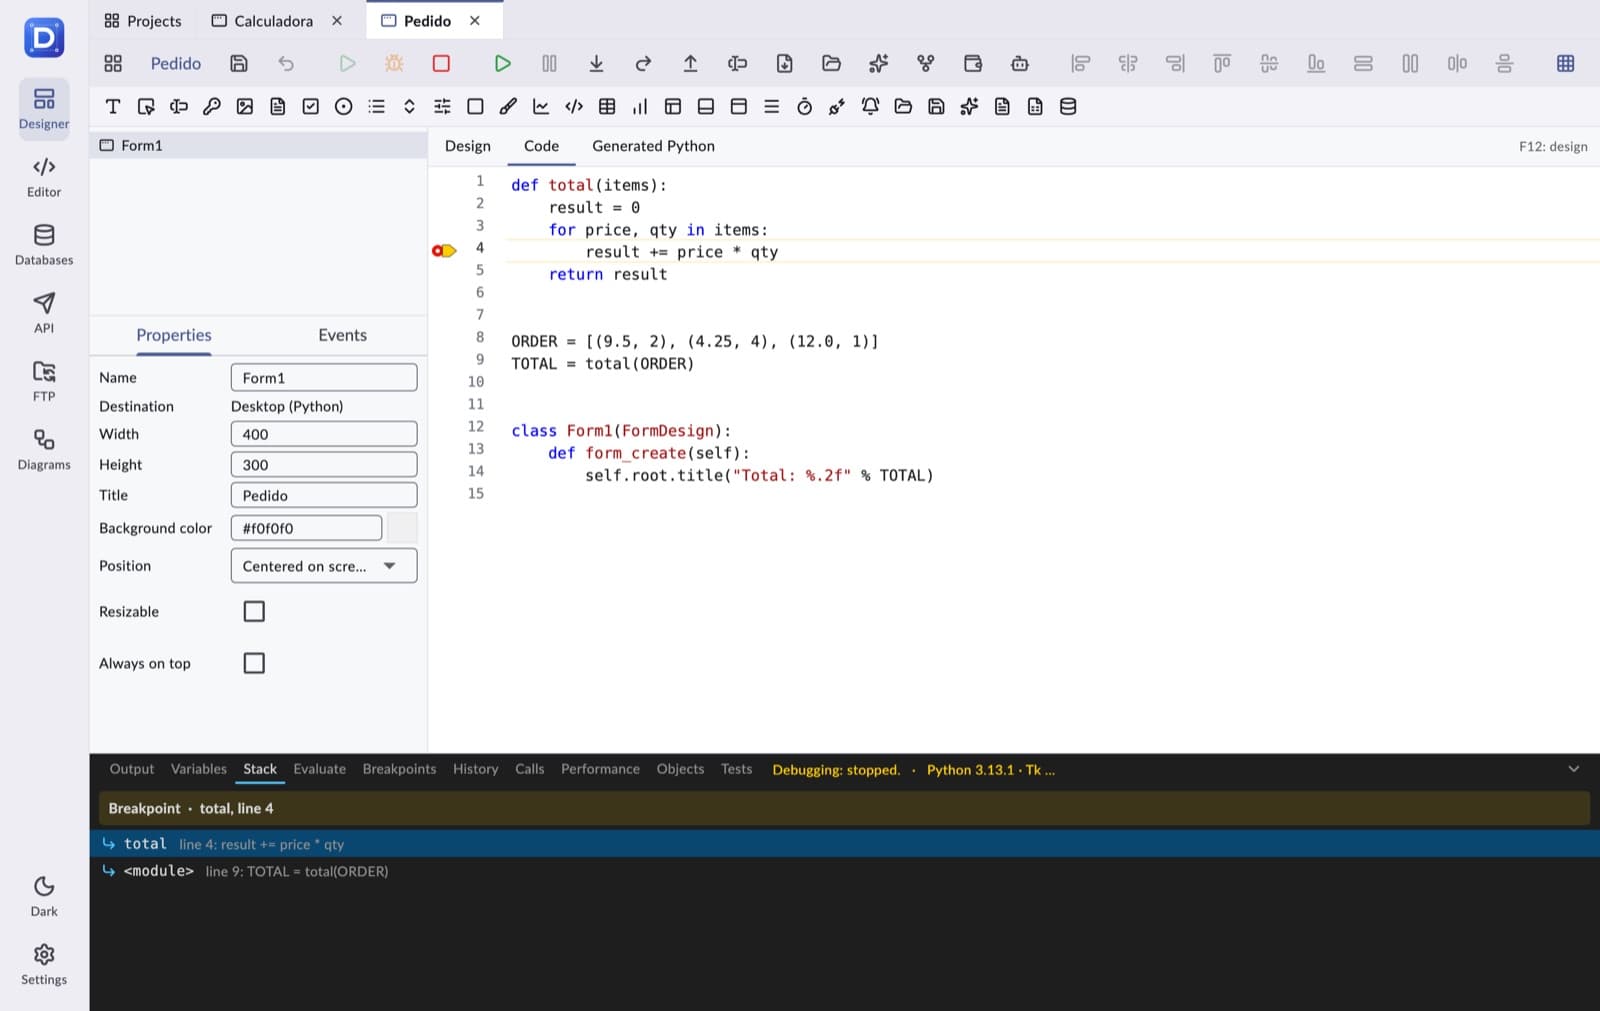
self) expand to show their state. - Stack: the chain of calls up to the current line. Clicking a frame chooses it: the variables change and the editor jumps to its line. If it stopped on an error, the full traceback is below.
- Evaluate: type a Python expression (
self.total,len(items)) and press Enter. Assignments (n = 5) also work, to change a value before carrying on. - Breakpoints: every breakpoint with its line and condition; edit or remove them here, and choose when to stop on exceptions: never, on uncaught ones (the default: an error in an event stops at its line) or on all of them, including the ones your code catches with
try.
History, calls, performance and objects
- History: the last lines of your code that ran, with the time and the function. A click takes you to the line.
- Calls: every call to a function of your code and its return, indented by depth and with how long it took: the flow of the program.
- Performance: for every function, how many times it was called and its total, mean and maximum time (not counting debugger pauses), and the most executed lines. It updates by itself; Reset sets the counters to zero.
- Objects: how many live objects there are of each class of your program (and tkinter widgets): handy to see whether something is created too many times.
Tests
The Tests tab runs the unittest tests in the project's tests folder (test_*.py files). Create a sample test adds tests/test_form1.py: tests import your program with from dms_app import Form1 (for a web app, from dms_app import app and its test client).
import unittest

from dms_app import Form1


class TestForm1(unittest.TestCase):
    def setUp(self):
        self.form = Form1()
        self.form.root.withdraw()

    def tearDown(self):
        self.form.root.destroy()

    def test_title(self):
        self.assertTrue(self.form.root.title())
Run tests shows every test in green, in red (click it to see its error) or skipped. Debug tests runs them under the debugger: they stop at the breakpoints in your code.