Lesson 2 · 2 of 20
A bar chart · tkinter
Draw a bar chart on a tkinter Canvas from a dictionary of data: scale, grid lines, axes and labels.
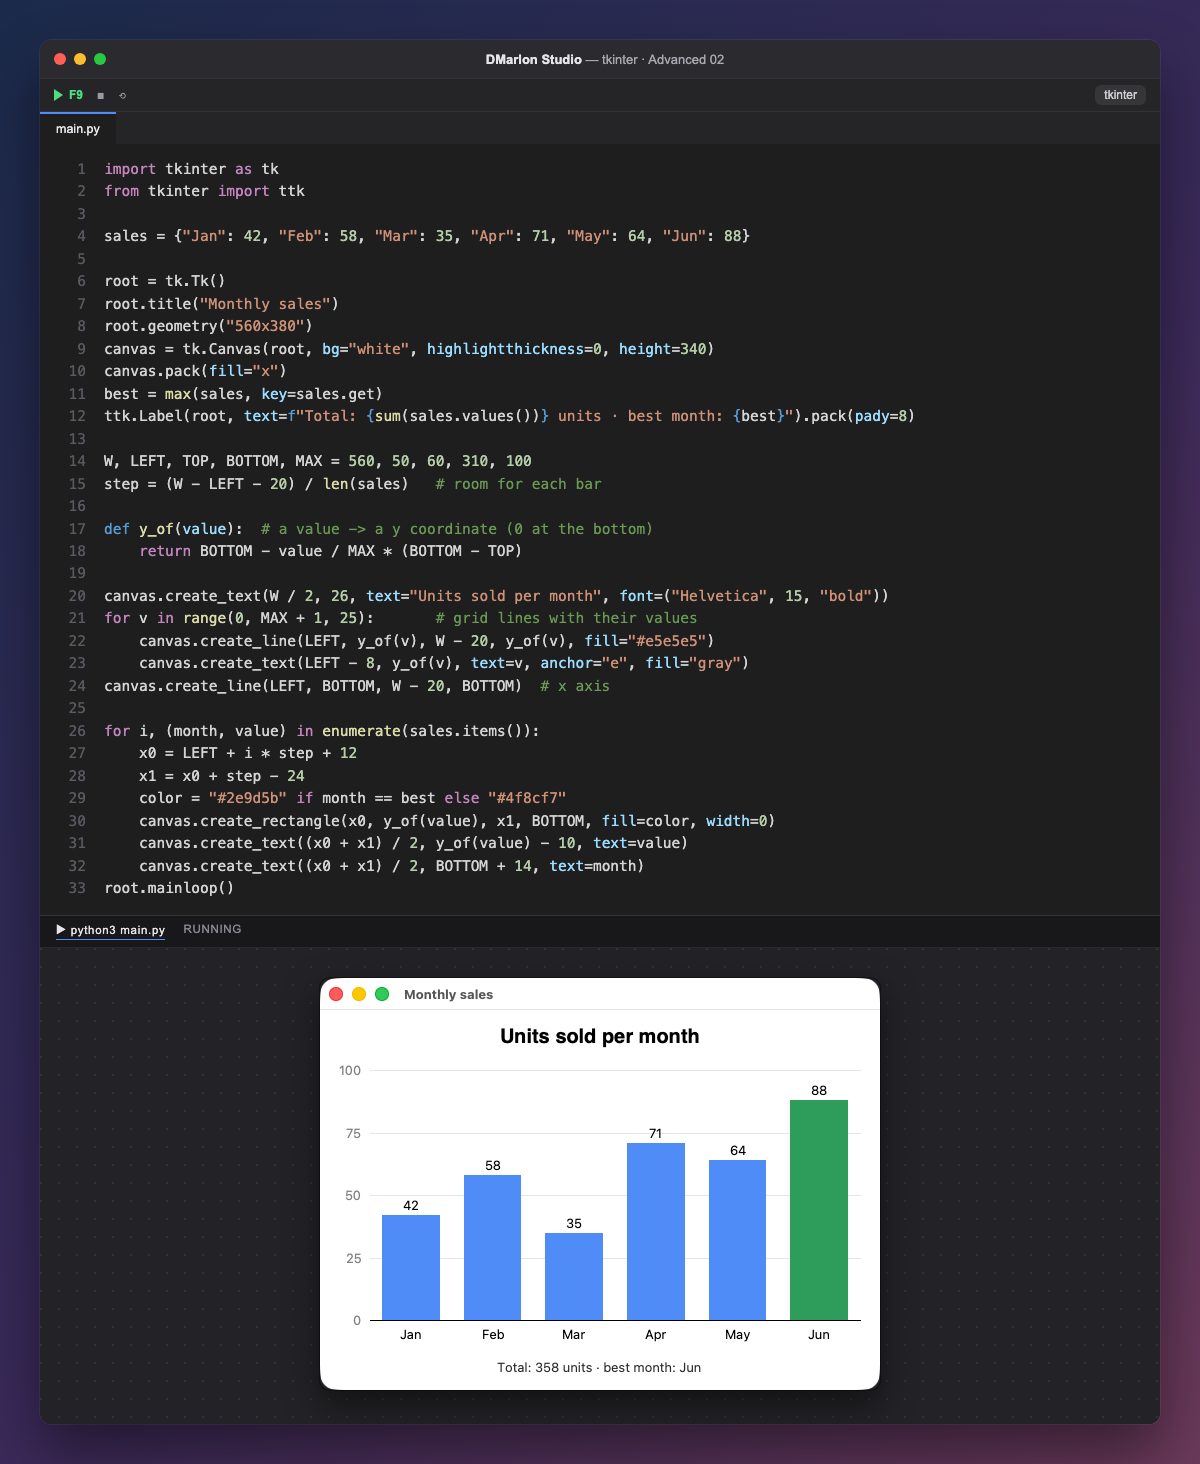
The data is a dictionary, sales: each month with its units sold. The chart is not drawn by hand: the loop builds it from the data, so if a number changes, its bar changes.
The key is scaling: y_of(value) turns a value (from 0 to MAX) into a y coordinate between BOTTOM and TOP. Since the canvas y grows downwards, we subtract: 0 sits at the bottom and 100 at the top. Each bar gets a slot step wide (the usable width divided by the number of months), minus 12 pixels on each side to keep them apart.
The background goes first: a grid line every 25 units, with its value on the left (anchor="e" right-aligns the text), and the x axis. Then each bar with create_rectangle (width=0: no border), its value above and the month below. Whatever is drawn later sits on top.
max(sales, key=sales.get) finds the best month, and its bar is green. The ttk.Label at the bottom adds up the total with sum(sales.values()).
In DMarlon Studio you don't have to draw it: the Chart component in the palette draws lines, areas, bars or candles, with the title, axes, legend and grid you choose in the inspector, and the studio writes the tkinter code. This lesson shows what lies underneath: a canvas and a little arithmetic.
Code · main.py
import tkinter as tkfrom tkinter import ttksales = {"Jan": 42, "Feb": 58, "Mar": 35, "Apr": 71, "May": 64, "Jun": 88}root = tk.Tk()root.title("Monthly sales")root.geometry("560x380")canvas = tk.Canvas(root, bg="white", highlightthickness=0, height=340)canvas.pack(fill="x")best = max(sales, key=sales.get)ttk.Label(root, text=f"Total: {sum(sales.values())} units · best month: {best}").pack(pady=8)W, LEFT, TOP, BOTTOM, MAX = 560, 50, 60, 310, 100step = (W - LEFT - 20) / len(sales) # room for each bardef y_of(value): # a value -> a y coordinate (0 at the bottom) return BOTTOM - value / MAX * (BOTTOM - TOP)canvas.create_text(W / 2, 26, text="Units sold per month", font=("Helvetica", 15, "bold"))for v in range(0, MAX + 1, 25): # grid lines with their values canvas.create_line(LEFT, y_of(v), W - 20, y_of(v), fill="#e5e5e5") canvas.create_text(LEFT - 8, y_of(v), text=v, anchor="e", fill="gray")canvas.create_line(LEFT, BOTTOM, W - 20, BOTTOM) # x axisfor i, (month, value) in enumerate(sales.items()): x0 = LEFT + i * step + 12 x1 = x0 + step - 24 color = "#2e9d5b" if month == best else "#4f8cf7" canvas.create_rectangle(x0, y_of(value), x1, BOTTOM, fill=color, width=0) canvas.create_text((x0 + x1) / 2, y_of(value) - 10, text=value) canvas.create_text((x0 + x1) / 2, BOTTOM + 14, text=month)root.mainloop()Key points
- Scaling turns values into pixels with a simple proportion.
- y grows downwards, so subtract from
BOTTOM. - Whatever is drawn later sits on top.
- The loop draws whatever is in the data.
Exercise
Add July (95) and August (60) to the dictionary and check the bars share the space by themselves; then paint the bars below 40 in red.